
Banner year for statistics
Given the numerous headlines that boil down statistical results to near meaningless pablum, we can rest assured real raw death data escapes the media’s bedazzler obfuscation machine. You need look no further than PCR generated case data (aka casedemic) to see just how egregiously the “if it bleeds it leads so called press” take stretching the truth to get your heart to skip a beat.
Hospitalizations and death
Though sad, it’s the death data that matters during any analysis of the influenza, or coronavirus in this case, seasons. Learn more about the realities of what to use as your measuring stick in this short video focusing on Ireland, but applicable to all…
https://www.youtube.com/watch?v=XVicIzxqCWE
Key points:
- Flu seasons see a trigger, a sharp rise, then a fall off.
- The ending of flu season is a combination of buildup of community immunity and the flu season ending.
- Seasonal de-triggering in the summer (northern temperate region) is real.
- The elderly are, by a large margin, the most susceptible to COVID-19.
- Watch out for organizations that sum the excess deaths from the distinct 2019/2020 and 2020/2021 flu seasons to produce a “bigger” death toll to terrify readers.
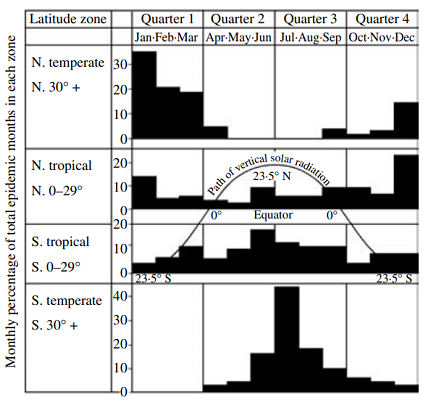
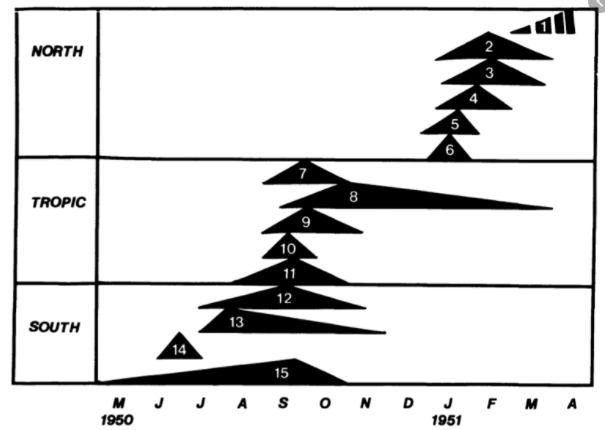
- Edgar Hope-Simpson covered this decades ago, describing the flu seasons for various regions of the world (Important!).
Hope-Simpson?
Recommended reading…

Get yourself a copy of this book to glean the history of influenza and other viral infectious agents. It supports the flu season graphs seen in Ivor Cummins video, but also reveals the expectations for a summertime triggering in “tropical” regions of which the northern tropical region includes the American south.
It’s interesting to the southern summertime bump attributed primarily to societal stimuli and seen in this VCU article while completely missing the fact southern states during an epidemic should expect the very data they see.
Death data
As morbid a topic this is, death data in its raw total form is very useful to:
- See total deaths,
- Note the seasonal characteristics that fit Hope-Simpson’s seasonal chart,
- Consider seasonal excess deaths in context of the flu seasons of that area,
- Consider the patterns of excess deaths compared to previous years (very important),
- Note how the rise in excess deaths compare to the baseline deaths from all other causes.
All the above provide perspective how SARS-CoV2 affects us.
Country data from mortality.org
Mortality.org collects death data from 38 countries. Some countries have data going back to the 1990s. Some begin at 2015. I maintain a large graphic file plotting the last ten years weekly data. Click the image below…

Weekly death data from mortality.org
The shaded regions in the graph represent the Northern Temperate flu season – October to May. In time I will shade each country according to its geographically applicable flu season.
US state data from the CDC
A similar data set is found for the US states from the CDC. Unfortunately this weekly data only covers 2020 and 2021, but the format is perfect for analysis. Here is the large file containing a plot of all deaths vs. time.

US weekly death data from the CDC
Again the shaded regions show the northern temperate flu season despite many states being in the northern tropical region. Arrows point to where lock downs became reality with a down arrow suggesting when things returned to normal.
Conclusion
Have a look at the data every week and come to your own conclusions how severe or not the excess deaths are for the world and its regions.
You must be logged in to leave a reply.